Board Reporting Service Plans
Our Board Reporting Service streamlines board reporting for busy high school college counselors on tight deadlines. Featuring the latest available admissions data and rankings along with comprehensive analysis of your results, the service gets you out of data jockeying and focused on delivering insights to your board.
It's easy to get started: select the plan below that best fits your needs, upload your data and give us 2-3 business days to complete the analysis and return results.
Standard
$750
$750
Comprehensive outcomes report covering:
- Admission highlights
- Matriculation highlights
- Admission results by application plan
- Waitlist trends NEW
- Results for most popular institutions
- Results by Barron's and U.S. News rankings
- Quintile analysis summaries
- 2-3 business day turnaround
Plus
$1,250
$1,250
Includes the outcomes report plus:
- Detailed quintile analysis report for assessing results by academic cohort
- Admission/matriculation summary and worksheet for easy school profile creation
- Detailed admission history report for comparing high school results against national context
- 2-3 business day turnaround
Board Reporting Service Features
-
Outcomes Summary
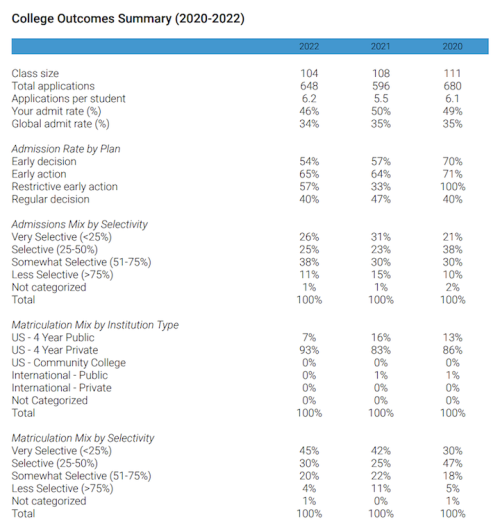
Our comprehensive outcomes report begins with a summary of admission and matriculation highlights for the most recent three years.
You'll be able to track simple items like class size and applications per student, as well as compare your high school's overall admission rate to the comparable national/global admission rate for schools your students have applied to.
You'll also be able to see admission and matriculation trends by admission plan, school selectivity and institution type. This information is further enumerated in later sections of the report.
-
Admission Trends
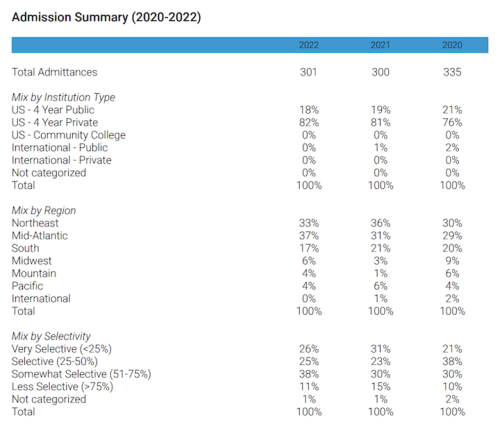
The Results by Admission Plan section helps you focus on admission trends. You'll be able to see a complete breakdown of applications, admittances, enrollments and admission rates by application type.
Particular focus is paid to early admission trends.
-
Matriculation Trends
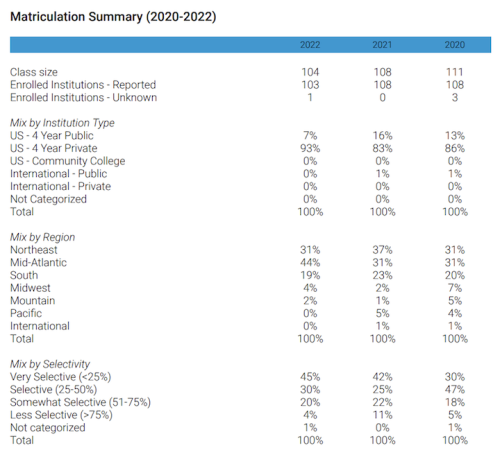
The Matriculation Summary helps you track where your seniors have opted to enroll over the most recent three years.
Matriculation results are broken out based on institution type, geographic region and admissions selectivity.
-
Waitlist Trends NEW
-
Results for Most Popular Institutions
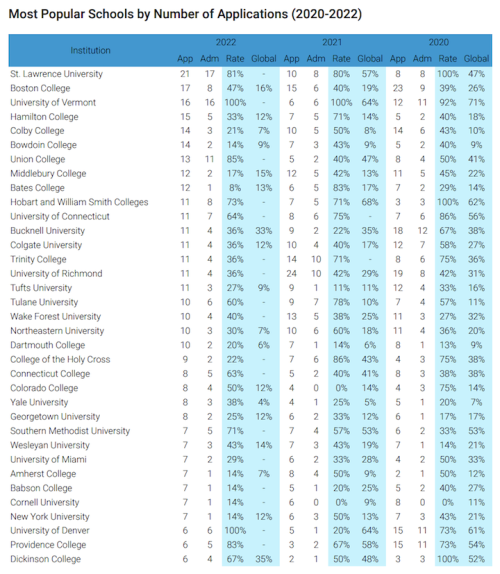
We'll also show you the most popular schools in which students applied. Helps compare the acceptance rate against national ones.
Results for the most recent three years are provided—including the latest available Class of 2026 admission rates—to help you stay on stop of trends.
-
Waitlist Results for Most Popular Institutions NEW
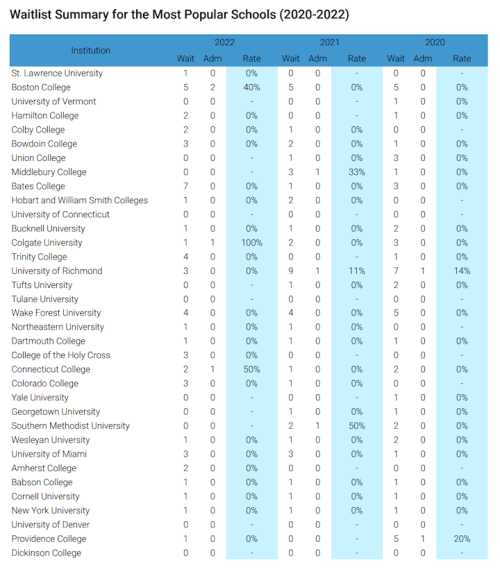
You'll also be able to track waitlist results for the most recent three years for your most popular institutions by application
-
Barron's and U.S. News Rankings
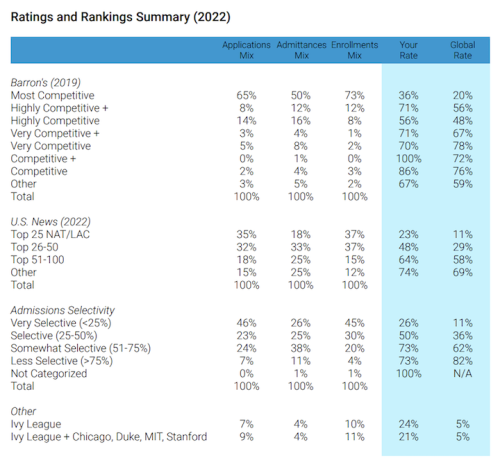
The Ratings and Rankings Summary segments your most recent graduating class utilizing the latest available data from Barron's and U.S. News.
You'll be able to see breakdowns of applicants, admittances and enrollments by cohort—for Barron's Most Competitive or U.S. News Top 25 national universities and liberal arts colleges—as well as compare your high school's admission rate to the national/global admission rate for that cohort.
If you're not big on Barron's or U.S. News, we also include an objective measure, admissions selectivity, as a way to assess outcomes. Ivy and Ivy+ breakdowns are also included.
-
Quintile Summaries
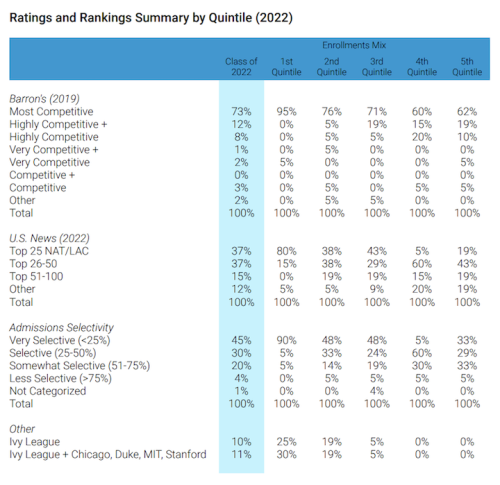
Finally, the core outcomes report also breaks out results by quintile to help you delve deeper into how results vary based on academic performance.
Quintile breakdowns are provided for both enrollment mix (pictured) and admission rates (not pictured).
-
Detailed Quintile Analysis (Plus only)
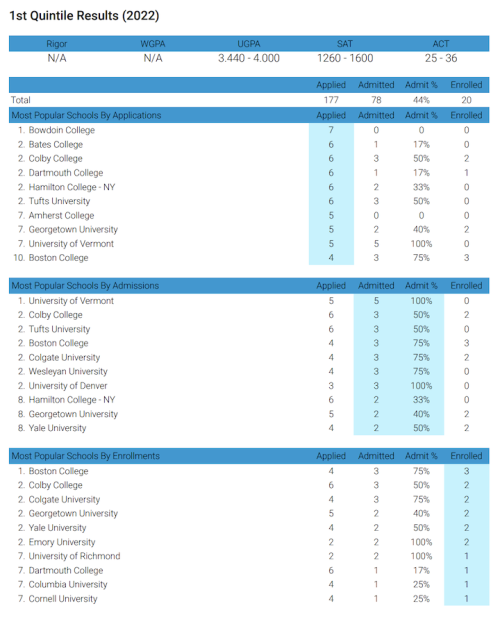
Plus edition subscribers also receive a detailed quintile analysis report.
GPA and test score bands are provided for each quintile as well as a summary of where students applied, where they were admitted and where they enrolled.
It's a great way to see how school choices and results vary by academic performance and to ensure weaker students are also being effectively supported.
-
Admission/Matriculation Worksheet (Plus only)
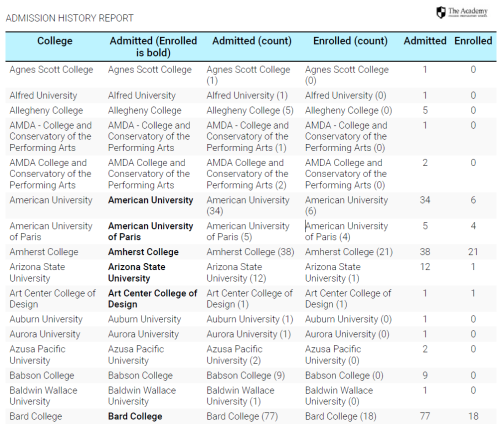
Plus edition subscribers also receive an admission/matriculation summary and accompanying worksheet.
The worksheet tabulates admission and matriculations to each institution and makes it easy to update your school profile each year.
-
Detailed Historical Admissions Report (Plus only)
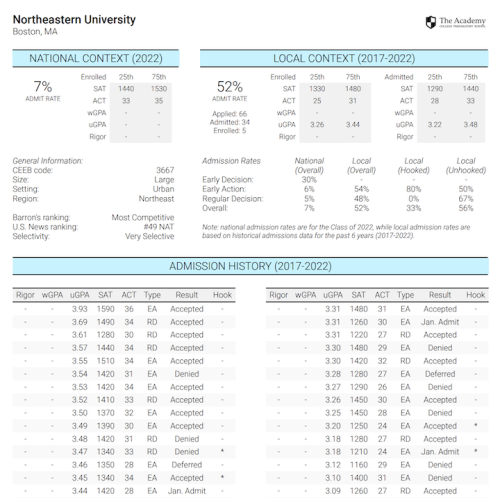
Plus edition subscribers also receive a Detailed Historical Admissions Summary for each institution with at least five admitted or enrolled students from your high school.
The report gives you the ability to:
- Compare your historical admission rates and academic profiles against national data
- Understand how your school's admission rates for each institution vary by application type
- If you track hooked applicants in your data, you'll also be able to compare admission rates for hooked and unhooked applicants
- View the academic credentials, application type and results for each applicant to each institution