Articles tagged with: Waitlist

22 May 2024

Class of 2028 Waitlist Notification Dates and Stats

Posted in Class of 2028, Waitlist

UPDATE #3 (6/27)

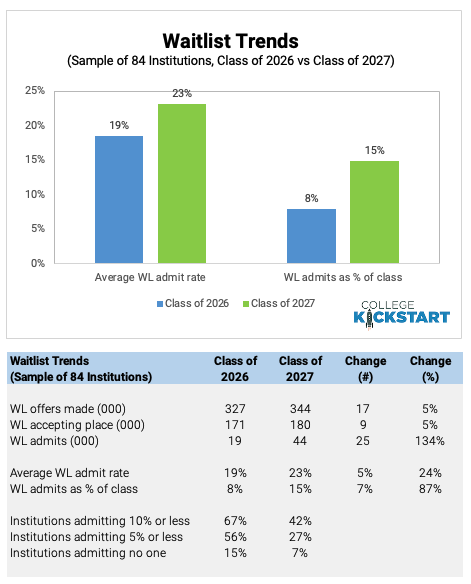
Waitlist Trends (Class of 2026 vs Class of 2027)For those of you who have been waitlisted at one of your top choices, here's our initial update of Class of 2028 waitlist notification dates and status where available.  

To get a sense for what's happening at the macro level, we took a look at recently released Class of 2027 waitlist statistics from 84 private and public institutions.  Our analysis paints the following picture:

  • The number of students admitted from the waitlist increased 134 percent year over year from 19,000 for the Class of 2026 to 44,000 for the Class of 2027
  • On average, 23 percent of Class of 2027 students accepting a place on a waitlist were admitted, down from 19 percent in for the Class of 2026
  • Students admitted from the waitlist accounted for 15 percent of Class of 2027 enrollments, up from 8 percent for the Class of 2026
  • 42 percent of the schools sampled admitted 10 percent or less of the students accepting a place on the waitlist for the Class of 2027 (vs. 67 percent for the Class of 2026)

Be sure to bookmark this page as we expect to be updating status over the next several weeks.

Click Continue Reading for the list.

22 May 2023

Class of 2027 Waitlist Notification Dates and Fall 2022 Stats

Posted in Class of 2026, Waitlist

UPDATE #2 (5/22)

Waitlist Trends (Class of 2025 vs Class of 2026)For those of you who have been waitlisted at one of your top choices, here's our initial update of Class of 2027 waitlist notification dates and status where available.  

To get a sense for what's happening at the macro level, we took a look at recently released Fall 2022 waitlist statistics from 101 private and public institutions.  Our analysis paints the following picture:

  • The number of students admitted from the waitlist declined 3 percent year over year from 26,000 for the Class of 2025 to 20,000 for the Class of 2026
  • On average, 19 percent of Fall 2022 students accepting a place on a waitlist were admitted, unchanged from the previous year
  • Students admitted from the waitlist accounted for 8 percent of Fall 2022 enrollments, down slightly from 9 percent for Fall 2021
  • 62 percent of the schools sampled admitted 10 percent or less of the students accepting a place on the waitlist for Fall 2022 (vs. 57 percent for the Fall 2021)

Be sure to bookmark this page as we expect to be updating status over the next several weeks.

Click Continue Reading for the list.

25 June 2022

Class of 2026 Waitlist Notification Dates and Stats

Posted in Class of 2026, Waitlist

UPDATE #3 (6/25)

Waitlist Trends (Class of 2024 vs Class of 2025)For those of you who have been waitlisted at one of your top choices, here's our initial update of Class of 2026 waitlist notification dates and status where available.  

To get a sense for what's happening at the macro level, we took a look at recently released Class of 2025 waitlist statistics from 120 private and public institutions.  Our analysis paints the following picture:

  • The number of students admitted from the waitlist declined 46 percent year over year from 61,000 for the Class of 2024 to 33,000 for the Class of 2025
  • On average, 15 percent of Class of 2025 students accepting a place on a waitlist were admitted, down from 32 percent in for the Class of 2024
  • Students admitted from the waitlist accounted for 13 percent of Class of 2025 enrollments, down from 27 percent for the Class of 2024
  • 61 percent of the schools sampled admitted 10 percent or less of the students accepting a place on the waitlist for the Class of 2025 (vs. 28 percent for the Class of 2024)

As expected, surge in waitlist activity brought on by the pandemic to more normal levels with the Class of 2025, as institutions worked through a surge in gap year deferrals, vaccinations kicked into gear and students were finally able to return to campus. We anticipate waitlist activity to continue to moderate for the Class of 2026.

Be sure to bookmark this page as we expect to be updating status over the next several weeks.

Click Continue Reading for the list.

30 June 2021

Class of 2025 Waitlist Notification Dates and Stats

Posted in Class of 2025, Waitlist

UPDATE #3 (6/30)

Waitlist Fall 2020 DistributionFor those of you who have been waitlisted at one of your top choices, here's a list of 2020 waitlist statistics for several popular private and public schools, along with notification dates and latest status where available.  

Our sample of waitlist statistics from 100 private and public institutions paints the following picture:

  • The number of students admitted from the waitlist rose 97 percent year over year from 22,223 in 2019 to 43,867 in 2020
  • On average, 29 percent of students accepting a place on a waitlist were admitted in 2020, up from 18 percent in 2019
  • 33 percent of the schools admitted 10 percent or less of the students accepting a place on the waitlist last year (vs. 48 percent in 2019)
  • 17 percent of the schools admitted 5 percent or less (vs. 29 percent in 2019)
  • 3 percent admitted no one (vs. 8 percent in 2019)

These results come as no surprise given the uncertainty brought on by the pandemic last cycle. That said, we strongly caution against assuming a similar level of waitlist activity this cycle as much of this uncertainty is now behind us and most schools are resuming normal operations.

Be sure to bookmark this page as we expect to be updating status over the next several weeks.

Click Continue Reading for the list.

23 June 2020

Class of 2024 Waitlist Notification Dates and Stats

Posted in Class of 2024, Waitlist

UPDATE #3 (6/23)

waitlist1920indexFor those of you who have been waitlisted at one of your top choices, here's a list of 2019 waitlist statistics for several popular private and public schools, along with notification dates and latest status where available.  

Our sample of waitlist statistics from 132 private and public institutions paints the following picture:

  • The number of students admitted from the waitlist more than doubled year over year from 9,882 in 2018 to 21,180 in 2019
  • On average, 15 percent of students accepting a place on a waitlist were admitted in 2019, up from 7 percent in 2018
  • 48 percent of the schools admitted 10 percent or less of the students accepting a place on the waitlist last year (vs. 70 percent in 2018)
  • 27 percent of the schools admitted 5 percent or less (vs. 44 percent in 2018)
  • 7 percent admitted no one (vs. 12 percent in 2018)

Given the uncertainty caused by COVID-19, we fully expect the rise in waitlist activity to continue for 2020 (Class of 2024).

Be sure to bookmark this page as we expect to be updating status over the next several weeks.

Click Continue Reading for the list.

29 May 2019

Class of 2023 Waitlist Notification Dates and Stats

Posted in Class of 2023, Waitlist

UPDATE #3 (5/29)

waitlist2019For those of you that have been waitlisted at one of your top choices, here's a list of 2018 waitlist statistics for several popular private and public schools, along with notification dates and latest status where available.  

Our sample of waitlist statistics from 138 private and public institutions paints the following picture:

  • On average, 11 percent of students accepting a place on a waitlist were admitted
  • 71 percent of the schools admitted 10 percent or less of the students accepting a place on the wait list last year
  • 57 percent of the schools admitted 5 percent or less
  • 24 percent admitted no one

There are several factors driving the low rates, including the size of the waitlist (often very large), and how well a school anticipates its admissions yield. 

Click Continue Reading for the list.

28 June 2018

Class of 2022 Waitlist Notification Dates and Stats

Posted in Class of 2022, Waitlist

UPDATE #2 (6/28)

waitlist2018For those of you that have been waitlisted at one of your top choices, here's a list of 2017 waitlist statistics for several popular private and public schools, along with notification dates and latest status where available.  

Our sample of waitlist statistics from 132 private and public institutions paints the following picture:

  • On average, 13 percent of students accepting a place on a waitlist were admitted
  • 63 percent of the schools admitted 10 percent or less of the students accepting a place on the wait list last year
  • 51 percent of the schools admitted 5 percent or less
  • 16 percent admitted no one

There are several factors driving the low rates, including the size of the waitlist (often very large), and how well a school anticipates its admissions yield. 

Click Continue Reading for the list.

15 June 2017

Class of 2021 Waitlist Notification Dates and Stats

Posted in Class of 2021, Waitlist

UPDATE #3 (6/15)

waitlist2016For those of you that have been waitlisted at one of your top choices, here's a list of 2016 waitlist statistics for several popular private and public schools, along with notification dates and latest status where available.  

Our sample of waitlist statistics from 163 private and public institutions paints the following picture:

  • On average, 18 percent of students accepting a place on a waitlist were admitted
  • 55 percent of the schools admitted 10 percent or less of the students accepting a place on the wait list last year
  • 37 percent of the schools admitted 5 percent or less
  • 11 percent admitted no one

There are several factors driving the low rates, including the size of the waitlist (often very large), and how well a school anticipates its admissions yield. 

Click Continue Reading for the list.

13 May 2015

Waitlist Admission Rates and Notification Dates

Posted in Class of 2019, Waitlist

UPDATE #1

waitlistpie1415b127For those of you that have been waitlisted at one of your top choices, here's a list of waitlist statistics for several popular private and public schools, along with notification dates and links for more detail if available.  

Our sample of waitlist statistics from 127 private and public institutions paints the following picture:

  • On average, 18% of students accepting a place on a waitlist were admitted
  • Half of the schools admitted 10% or less of the students accepting a place on the wait list last year
  • 35% of the schools admitted 5% or less
  • 9% admitted no one

There are several factors driving the low rates, including the size of the waitlist (often very large), and how well a school anticipates its admissions yield. 

Click Continue Reading for the list.

Get our latest data and insights

Give your college plan a boost

Balance list, maximize odds and minimize wasted motion. Current data and personalized recommendations. 

Students, learn more Counselors, learn more